TARGETED & UNTARGETED
Metabolomics & Lipidomics Workflows
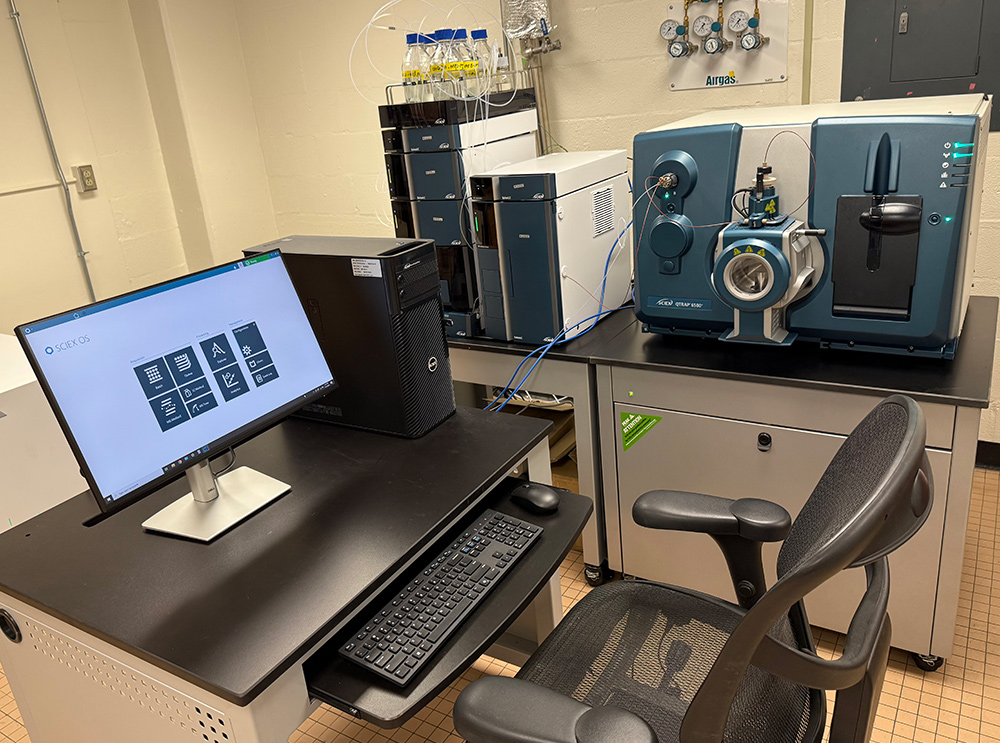
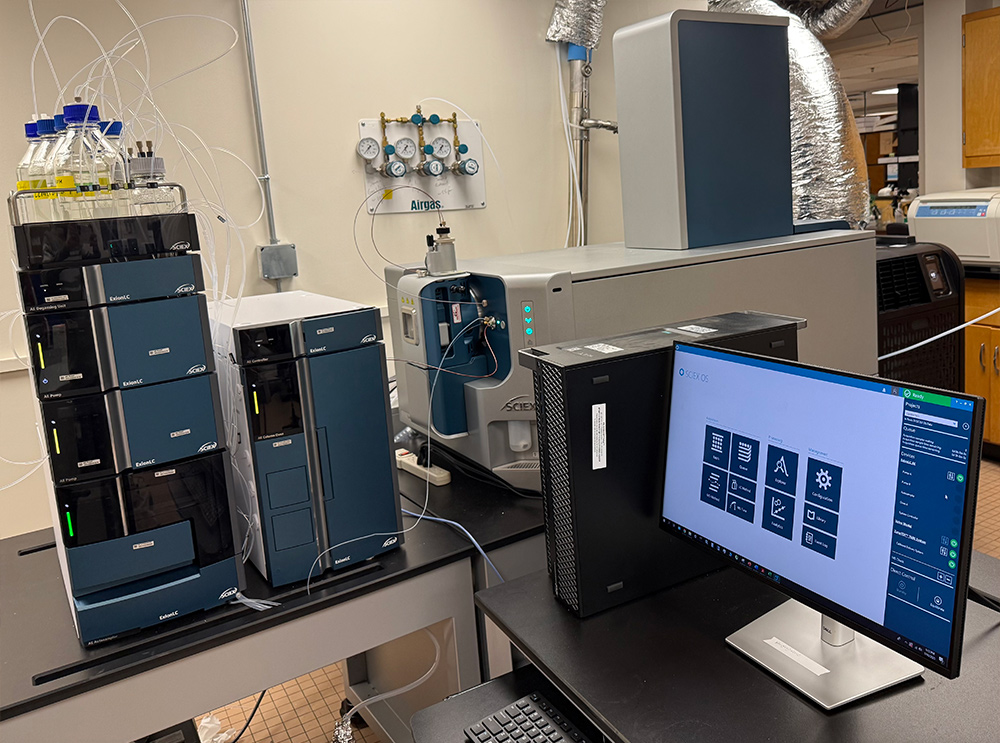
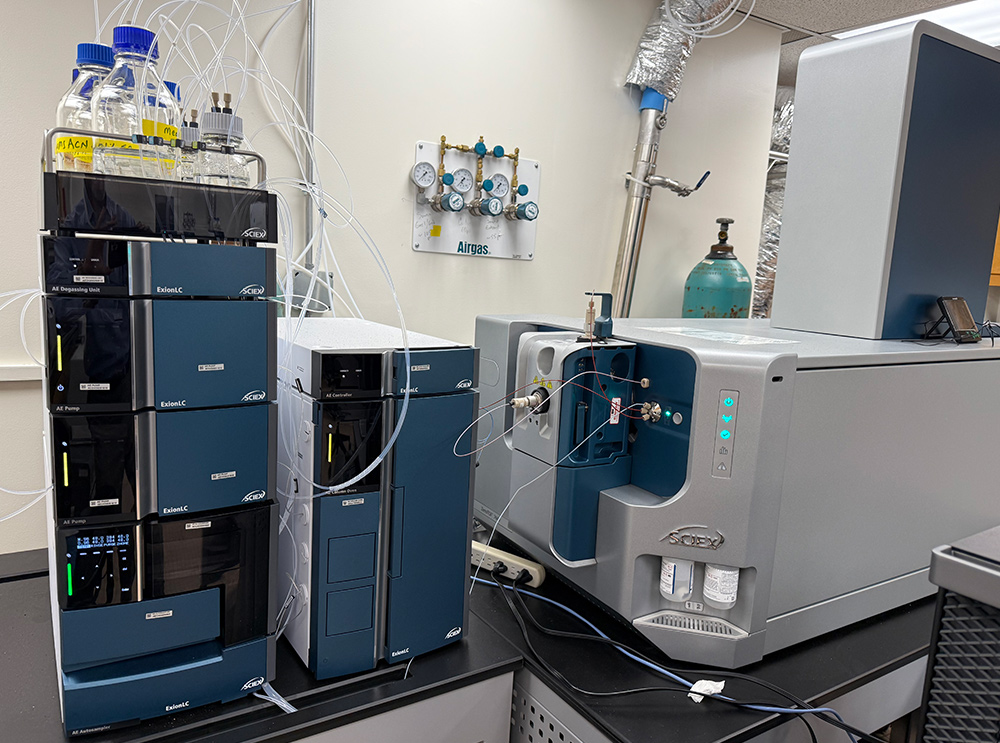
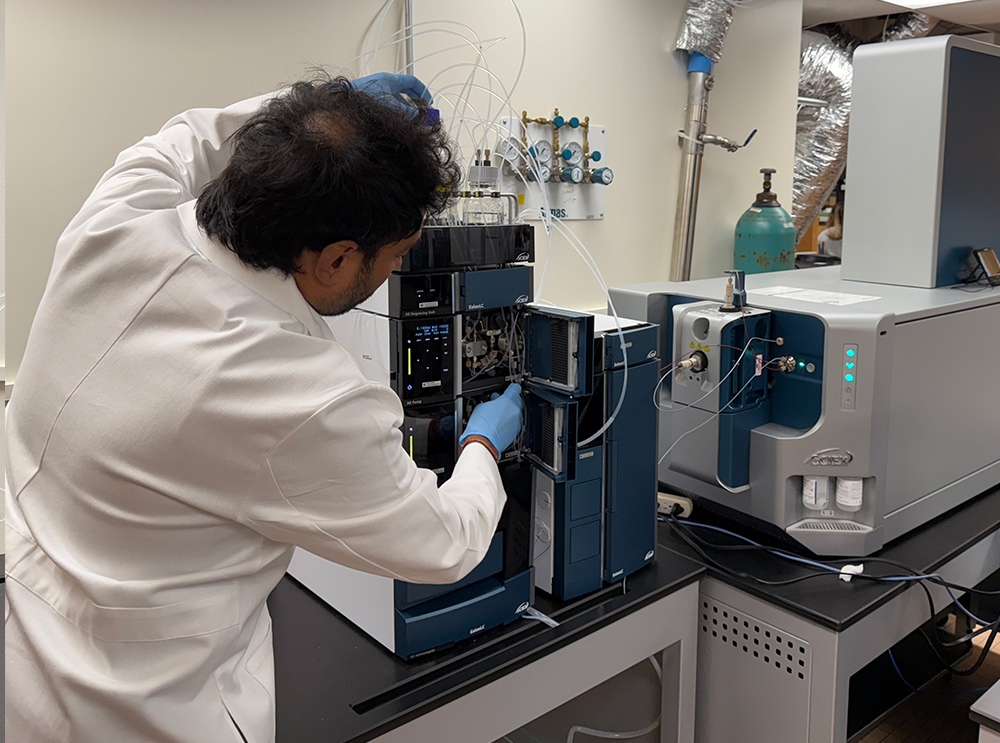
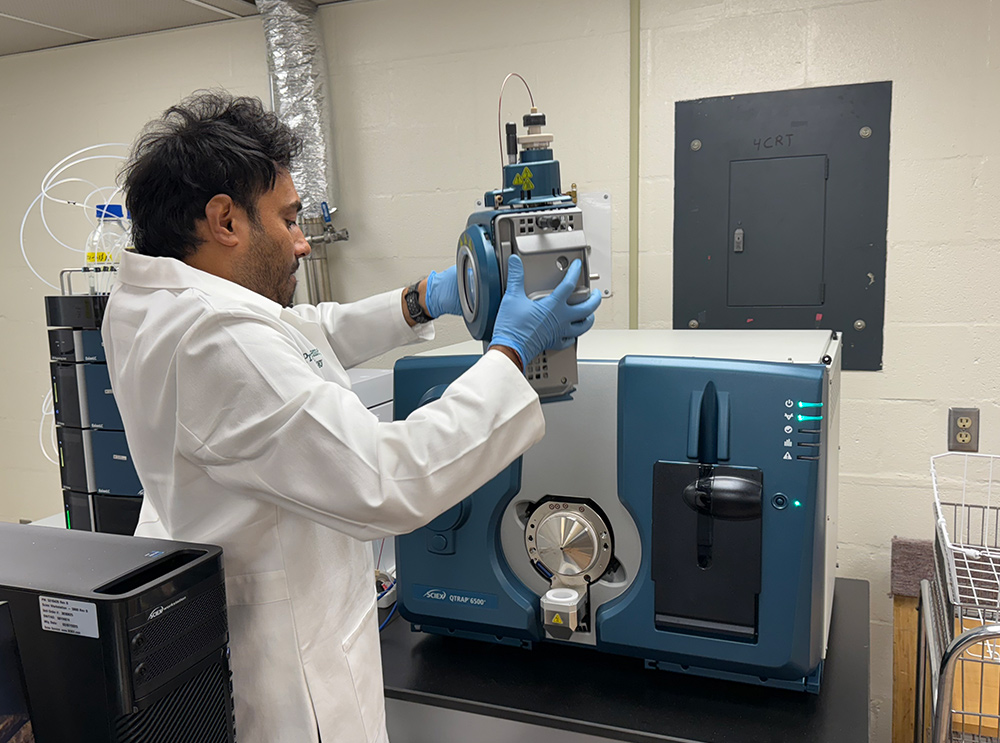
Equipment:
TULMAC is equipped with two state-of-the-art mass spectrometry systems that support both targeted and untargeted metabolomics and lipidomics workflows.
Sciex 7600 ZenoTOF High-Resolution Mass Spectrometer
Integrated with a dedicated ExionLC™ AE UHPLC system. This advanced system is utilized for untargeted metabolomics and lipidomics analyses, enabling comprehensive profiling of complex biological samples with relative quantitation.
Sciex 6500+ QTRAP Mass Spectrometer
Integrated with a dedicated ExionLC™ AE UHPLC system. This platform is dedicated to targeted and quantitative lipidomics and metabolomics analysis, offering high sensitivity and specificity for targeted and absolute quantitative biomarker discovery and validation.
Applications:
Metabolomics
Untargeted Metabolomics Workflow
Our untargeted metabolomics platform enables comprehensive annotation of a wide array of metabolite classes, including:
- Amino acids and their derivatives
- Fatty acids and fatty acyl-carnitines
- Tricarboxylic acid (TCA) cycle intermediates
- Dicarboxylic acids
- Carbohydrates and sugar phosphates
- Purine and pyrimidine metabolites
- Nucleosides, nucleotides, and analogs
- Cholesterol and steroid metabolites
- Bile acids
- Oxylipins (lipid mediators)
- Vitamins and enzyme cofactors
- Hydroxy fatty acids
- Organic acids and derivatives
- Dipeptides and polyamines
- Organoheterocyclic compounds
- Other miscellaneous small molecule
Depending on the sample type and concentration our workflow detects ~800 individual metabolite species using a stringent series of validations to ensure accuracy and reproducibility of the identified lipids.
Lipidomics
Untargeted Lipidomics Workflow
Our untargeted lipidomics platform provides broad lipid class coverage, identifying and annotating lipid species that include:
- Cholesteryl esters (CEs)
- Diacylglycerols (DAGs)
- Phosphatidylcholines (PC)
- Phosphatidylethanolamines (PE)
- Phosphatidylserines (PS)
- Phosphatidic acids (PA)
- Phosphatidylglycerols (PG)
- Sphingomyelins (SM)
- Ceramides (including hexosyl- and dihexosyl-ceramides)
- Triacylglycerols (TAGs)
Depending on the biological matrix and sample quantity, our workflow typically identifies ~1,200 distinct lipid species using a stringent series of validations to ensure accuracy and reproducibility of the identified lipids.
Analysis:
Depending on the study design and data type, our center employs a comprehensive suite of statistical and machine learning methods to extract meaningful biological insights from metabolomic/lipidomic datasets.
To identify discriminant metabolites/lipids across experimental groups, we apply a combination of univariate statistical analyses—including t-tests, fold-change analysis, and volcano plots—alongside multivariate dimensionality reduction and classification techniques.
Our multivariate approaches include principal component analysis (PCA), partial least squares discriminant analysis (PLS-DA), and sparse PLS-DA, which enable us to capture complex patterns in high-dimensional data and enhance group separation. Within the PLS-DA framework, metabolites with Variable Importance in Projection (VIP) scores greater than 1.5 are considered critical contributors to group differentiation.
For high-dimensional feature selection, we implement robust statistical models based on Z-scores and false discovery rate (FDR)-adjusted p-values. These include Significance Analysis of Metabolites (SAM) and Empirical Bayesian Analysis of Metabolites (EBAM), which help identify statistically significant changes while controlling for multiple testing. To evaluate the diagnostic or predictive power of specific metabolites/lipids, receiver operating characteristic (ROC) curve analysis is employed. This enables the assessment of classification performance and aids in identifying potential biomarker candidates, using metrics such as the area under the curve (AUC).
Additionally, we perform clustering analyses—such as hierarchical clustering and k-means clustering—to group metabolites/lipids based on similarity patterns, facilitating the identification of co-regulated or functionally related molecules. Further, correlation and network analyses are utilized to explore relationships among metabolites/lipids, uncovering interaction networks and regulatory modules that provide insights into metabolic crosstalk and pathway interconnectivity. Significantly altered metabolites/lipids identified through both univariate and multivariate analyses are subjected to downstream pathway enrichment and topology analysis using resources such as the Small Molecule Pathway Database (SMPDB) and MetaboAnalyst 5.0, enabling the integration of statistical findings with biological context.
Data analyses are conducted using a combination of tools, including MetaboAnalyst 5.0, a comprehensive web-based platform for statistical and pathway analysis; GraphPad Prism for data visualization and basic statistics; and custom R and Python scripts for advanced or tailored analytics.